26 October 2026
How to tell irrigated land from rainfed cropland in satellite imagery
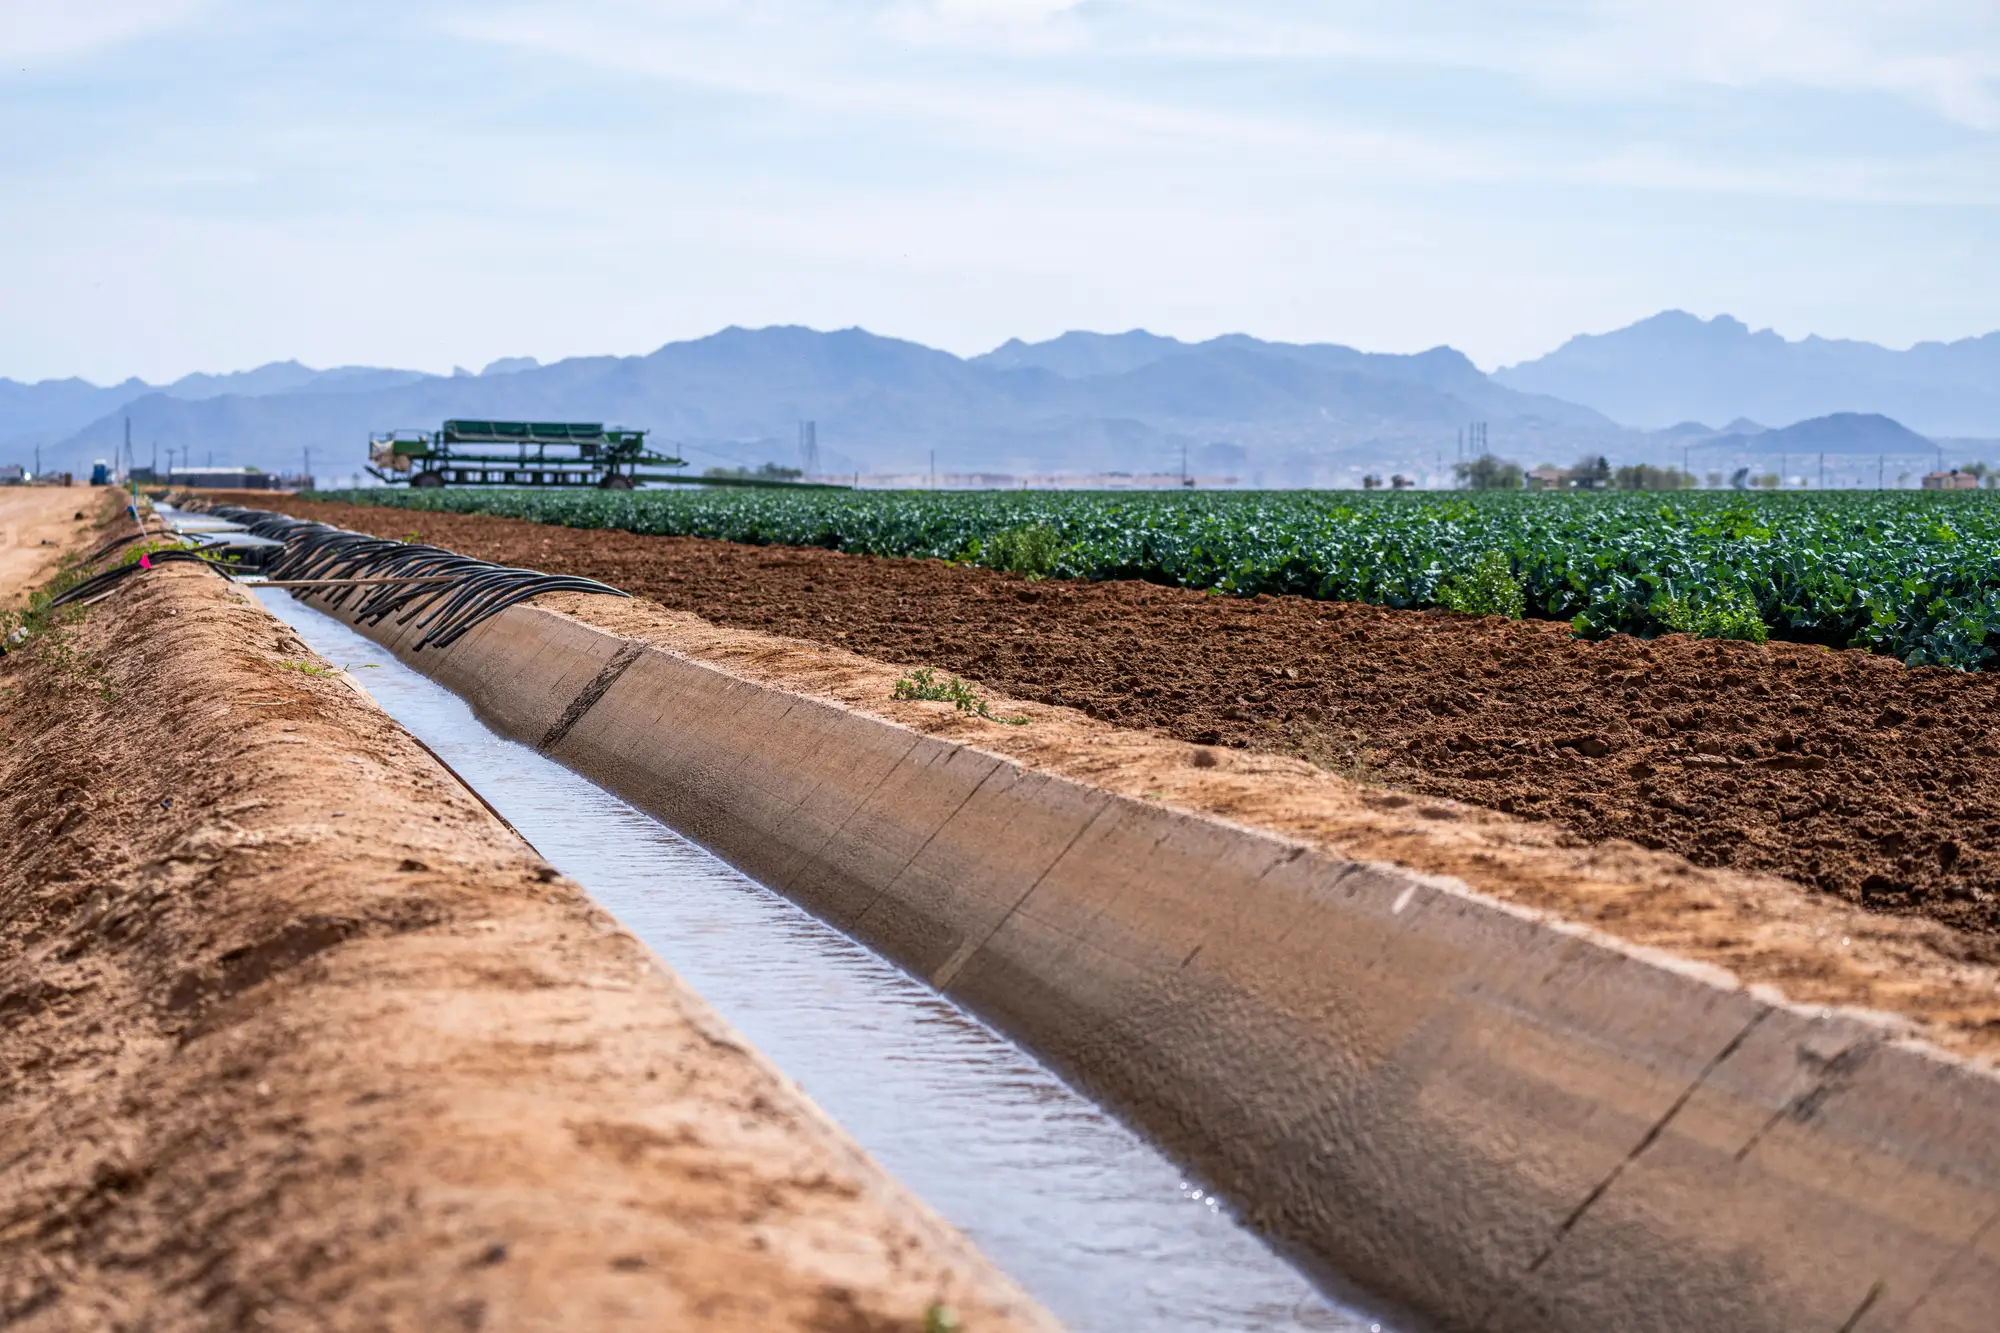
If you've pulled up a greenness index over your basin and tried to sort parcels into "irrigated" and "rainfed" by eye, you already know the single-image approach falls apart fast. A healthy rainfed field in a wet month looks just as green as an irrigated one. The tell shows up in how the field behaves across a season when the rain doesn't cooperate, not in any single pass.
The signal is timing, not color
A rainfed parcel greens up when rain falls and browns off when it stops, roughly in step with the rest of the unirrigated land around it. Chart its greenness against the basin's rainfall record and the two lines track each other, with a lag of a week or two for the crop to respond.
An irrigated parcel breaks that pattern. It greens up on a schedule set by the grower, not the sky, and it holds that greenness through dry spells that would brown a rainfed field in the same soil type sitting a quarter mile away. During a drought month, that gap is the whole story: irrigated fields keep their canopy, rainfed fields don't. In a wet year the two can look nearly identical for weeks at a stretch, which is exactly why a single pass or a single season of imagery isn't enough to call it either way.
Field geometry helps narrow the field, literally. Center-pivot circles and the sharp rectangular blocks fed by gravity or drip lines are a strong hint that someone built infrastructure to put water on that ground. But geometry alone has told you nothing about whether water moved this season, or when. A pivot can sit idle. A rectangular block can run dryland rotation in a fallow year. Shape tells you a parcel is equipped for irrigation, not that it was irrigated.
Where this breaks down for compliance work
The harder problem, the one that matters when you're trying to target a visit instead of eyeballing a false-color composite, isn't irrigated versus rainfed at all. It's catching the parcel that's irrigated outside the window its license allows. A permit holder with a spring allotment who keeps a field green into late summer looks, from a greenness chart alone, exactly like a well-run irrigated operation. You need the greenness record lined up against the licensed allotment window for that specific parcel, not a generic irrigated/rainfed split for the basin.
That's a different task than classifying land cover. It means reading a seasonal time series per parcel, picking out when the irrigation signal starts and stops, and checking that window against the licensed allotment for that parcel, regardless of what the crop calendar suggests is typical. A soybean field greening up in April in a basin where April draws aren't licensed is a more useful flag than "this field is irrigated," which you probably already knew.
This is the gap Irrigated Area Mapping is built to close: a seasonal irrigated-area layer per parcel, run against your basin's licensed volumes, with a flag list of the parcels showing activity outside their allotment window. It's a screening layer for deciding which forty parcels get a truck this month, not a metered volume record you'd cite in an enforcement finding.
A few things worth knowing if you're building this kind of check yourself:
- One pass tells you almost nothing. You need enough passes across a growing season to see the shape of the curve, not a snapshot.
- Compare against the parcel's own history, not just the basin average. A field that's always a late greener isn't suspicious. A field that just started greening a month earlier than its own five-year pattern is.
- Cloud cover will cost you passes in some seasons more than others. A wide-swath sensor with frequent revisit gives you more chances to catch the green-up window even when a pass or two gets clouded out.
- Geometry narrows your search area. Timing does the work. Use the pivot circles and rectangular blocks to decide where to look closely, then let the seasonal curve tell you what happened.
None of this replaces a field visit or a meter reading. What it does is tell you which forty parcels out of four thousand are worth the fuel to go check this month, instead of starting from the whole basin every time.
If you're trying to turn that seasonal signal into a working list of parcels to visit this quarter, that's the problem Irrigated Area Mapping is built around.