13 October 2026
Pivot vs. flood irrigation: telling them apart in satellite imagery
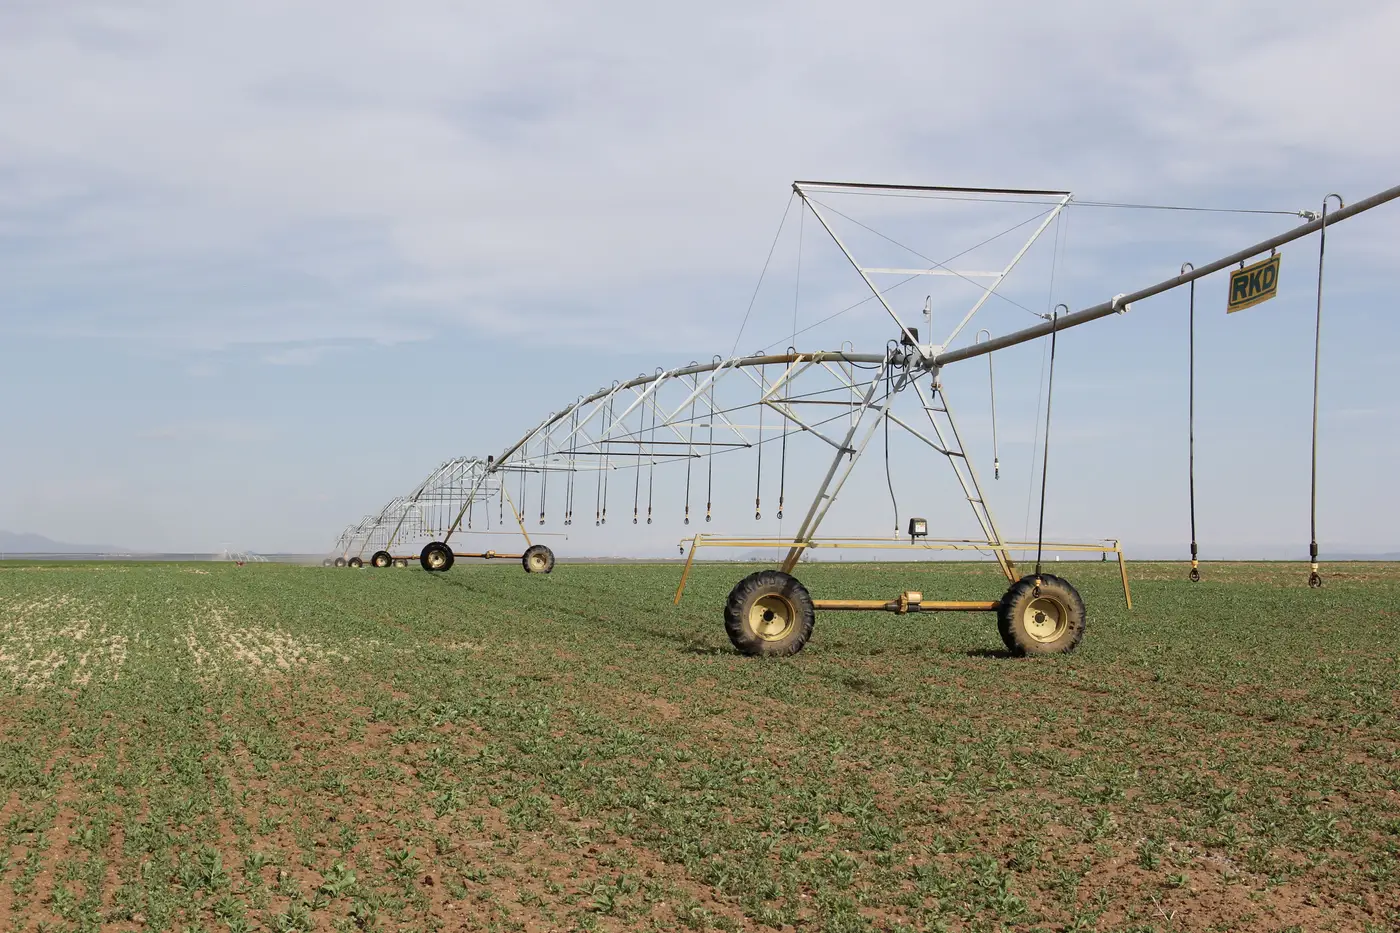
If you've pulled up a seasonal composite over a basin with mixed irrigation methods, you've probably noticed that not every green patch looks the same. Some are near-perfect circles. Some are rectangles that fill edge to edge like a solid block of color. Some green up fast and even; others show streaks. That's the irrigation method showing through in the imagery.
Knowing the difference matters when you're trying to figure out which parcel a flag actually belongs to, or whether a greening pattern lines up with a licensed diversion point at all.
Center pivot signature in satellite imagery
A center pivot leaves the most recognizable mark in remote sensing: a circle, or a slice of one if the field is clipped by a property line or a road. The pivot arm rotates around a fixed point, usually a well or a riser near the field's center, so the wetted area traces that radius with a clean, almost mechanical edge. On a single date you'll often see concentric rings where the growth stage differs slightly toward the arm's outer reach versus the center, since water and fertigation rates aren't perfectly uniform across the full sweep.
Across a season, pivot fields tend to green up in a fairly tight, predictable window tied to the crop's planting date and the irrigation schedule behind it. The signature is stable field to field: same shape, same rough timing, same clean boundary. If a pivot is running outside its usual window, say a full green ring showing up in a month that parcel's allotment doesn't cover, that stands out precisely because the normal pattern is so regular.
Flood irrigation signature in satellite imagery
Flood and furrow systems look different from the start. Instead of a circle, you get the field's actual boundary filled in, usually a rectangle or whatever shape the leveled basin or border strips were cut to. There's no pivot arm to trace, so the edge of the wetted area follows the parcel line, the head ditch, or the border checks.
The texture inside that boundary is where it gets interesting. Right after a flood-up, you can sometimes catch a sheen or a darker, wetter signal near the head end of the field where water enters, fading out toward the tail end where it's already drained or infiltrated. Furrow-irrigated fields often carry faint parallel striping that follows the furrow rows, especially visible before the canopy closes in and covers the soil between rows. A flood irrigator working a rotation across several parcels will green them up in sequence rather than all at once, so parcels light up a week or two apart even though they're adjacent and under the same ditch.
Why the distinction matters for a compliance screen
None of this tells you a volume. A green circle doesn't say how many acre-feet moved through the meter, and a wet-looking furrow field doesn't say how long the headgate was open. What the shape and timing do tell you is whether the irrigation activity you're seeing is consistent with how that parcel is supposed to operate, and whether it's happening inside the window its license allows.
That's the practical use: a pivot showing growth in an off-season month, or a flood parcel greening up well outside its rotation, is worth a look. A pivot behaving like a pivot and a flood field behaving like a flood field, on schedule, isn't where you spend a site visit.
This is exactly the gap a seasonal wide-swath pass over a basin is built to close. Irrigated Area Mapping reads that pass parcel by parcel, builds a seasonal irrigated-area layer, and flags the ones showing activity outside their licensed allotment window, so you know which few parcels to drive out to instead of checking the whole basin by hand.
If you're trying to narrow down a compliance visit list before the season turns, that flag list is worth a look.